背景简介
什么是Promethues
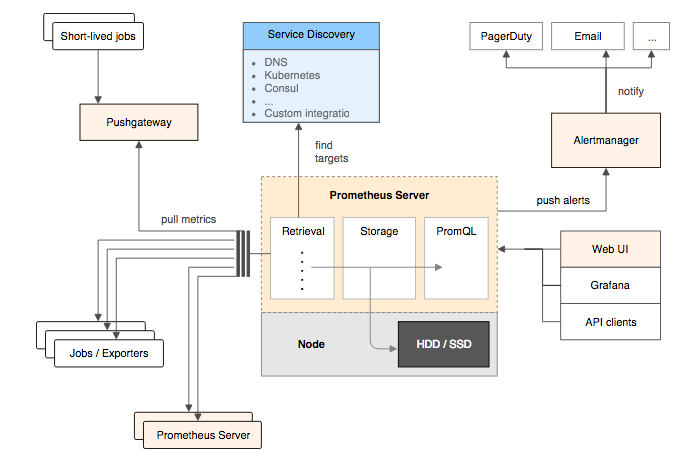
prometheus是一套开源的监控系统,可以非常全面地监测硬件服务器、存储、网络、API等监控对象。prometheus主要采用pull模式,即,prometheus服务器通过http get请求来获取各个监控对象的监控数据。当然,各监控对象需要安装相应的node expoter客户端。此外,由于一些特殊的监控和自定义监控,prometheus也提供了blackbox expoter黑盒监控和pushgateway等更灵活的获取监控数据的方式。
什么是pushgateway
pushgateway是prometheus监控系统中的一个可选组成部分。它类似于一个反向代理,Prometheus正常从pushgateway拉取监控数据,pushgateway的数据来自于用户自定义的metric,用户将这些metric push到pushgateway,即自定义脚本推送的数据。
为什么使用pushgateway
通常pushgateway用于解决网络与Prometheus不通的区域充当代理的角色,也可以实现一些自定义的metrics。
pushgateway与blackbox有什么不同
blackbox expoter也是prometheus重要组成部分,blackbox exporter主要的功能是接口监控,内置了很多icmp,tcp,http等监控模板。black expoter可以满足大部分api监控需求,但一些复杂参数的api监控并没有办法实现。另外blackbox也能充当代理的角色,这点和pushgateway是相似的。但pushgateway内置api接口支持用户自定义的metrics,这是blackbox exporter做不到的。
使用pushgateway监控需要上传文件的接口
需求描述
需求是需要对一批接口进行http状态码监控,这批接口要求指定header参数,另外必须上传图片
根据需求首先想到的是blackbox,添加监控比较方便,有现成模板,但是由于接口需要上传文件,查了官网资料,没有发现blackbox exporter内模板支持post请求文件上传,于是只能使用pushgateway
获取监控数据
我们需要把监控到的数据发给pushgateway,监控数据是post请求的状态码,使用以下脚本实现
1 | #定义api路径和请求头host参数 |
其中,
上传文件的路径需要以绝对路径引用,因为这个脚本将来是要被crontab执行的,工作目录并不是脚本所在目录
另外,可以先把push数据那句话注释掉验证请求结果
添加crontab任务
无误后,使用crontab定时45s执行
1 | #打开crontab配置文件 |
定时任务配置完成后,pushgateway就会周期性收到监控数据并更新了,如果prometheus 已经有pushgateway的job的话,就可以查到metrics了
配置prometheus.yml
如果prometheus没有集成pushgateway,则需要在prometheus.yml添加如下job并重载
1 | - job_name: 'pushgateway' |
1 | #prometheus热重载 |
重载后可在prometheus查询到新的metrics
1 | somejob_http_code{} |